
2018 seems like a lifetime ago. Remember the South Korean winter Olympics, President Trump’s trade wars, and the Tide Pod Challenge? It also was the last time that we had midterm elections. Election day this year is November 8th, and the prospects for a divided government are looking about as likely as Beltway traffic and teen conflict in my house (which is to say, highly likely).
Not only do Democrats hold a precariously thin majority in Congress, but also historical odds would seem to suggest divided government is the likely outcome. The incumbent President’s party has lost House seats in 17 of 19 midterm elections and Senate seats in 13 of 19 midterms since WWII. Polls right now indicate that the House will most likely move to the Republicans. The fate of the Senate, however, is a much tougher call, and will likely be decided by a handful of key races (PA, GA, NV, and AZ).
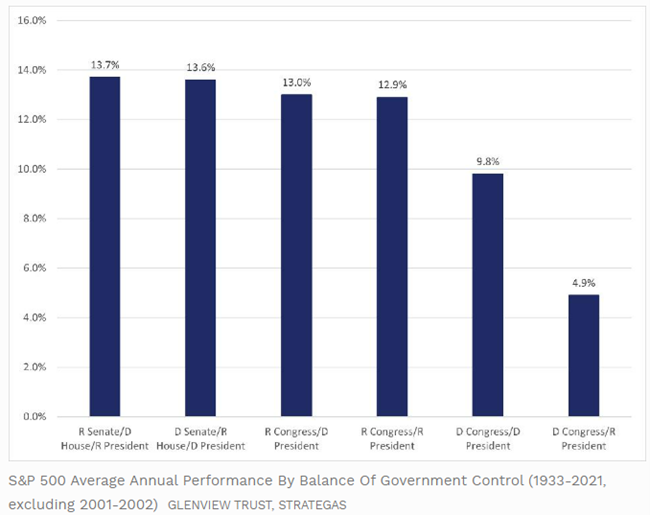
Setting aside your political beliefs and emotions, how should you feel as an investor? Well, largely agnostic to the outcome. As politics have become increasingly polarized, the markets have largely continued to ignore the outcome of elections. Voters had decidedly strong opinions about the prior two presidents, but average annual stock market returns during the Trump and Obama administrations were nearly identical at 16.0% and 16.3%, respectively. Furthermore, as you can see in the following chart of historical S&P 500 returns relative to government control, divided government does not spell doom for market performance:
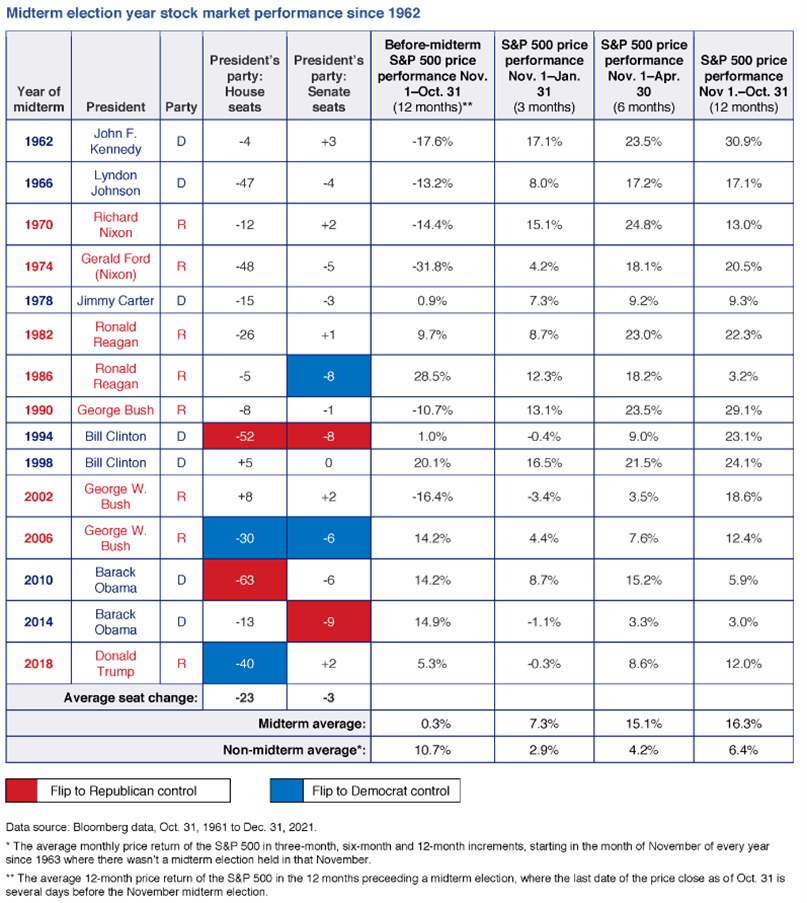
The correlation between stock market performance and midterm elections has been consistent throughout much of history. In 17 of the 19 midterms since 1946, the market performed better in the six months following a midterm election than it did in the six months leading up to it. As highlighted in the chart below, the average annual return of the S&P dating back to 1962 over the 12-month period preceding midterm elections has been 0.3% versus the historical average across all years of 8.1%. Conversely, after midterm elections, the S&P has returned an average of 16.3% over a 12-month timeframe.
One possible explanation for the historical market malaise preceding midterms followed by subsequent exuberance is the perceived fiscal policy uncertainty before the election and the greater policy certainty after the fact. However, if one were to dig deeper, one might find that economic backdrop is still very much a factor in equity market returns in an election year.
This year’s challenging macroeconomic environment and unsettling geopolitical events may complicate the post-midterm market reaction. Retail investors have been keenly focused on soaring inflation, extreme rate hikes to curb that soaring inflation, the potential for recession, and market volatility (which is a somewhat circular relationship). So perhaps investors are not off base in keeping their eyes trained on the Federal Reserve rather than on Capitol Hill, at least until November 2nd when our central bank is expected to raise interest rates yet again.
The bottom line is that as a long-term investor, you should not panic over the potential for divided government, which has been the most common configuration historically. You should stay the course with your investment strategy and not let political opinions and related emotions get the better of logic. At HCA, we continue to focus on actively positioning client portfolios to both preserve capital and to take advantage of opportunities for growth in certain areas of the market.
We are meme fans at HCA, and there were many voting memes during the midterms four years ago. Whether you feel like the carefree Pomeranian below or the snarling wolf or something in between, remember that stocks tend to go up over the long haul, regardless of politics.

By Allison Dunlap